
Haliburton Atlas: Comparing Four Townships That Define Almost Nothing the Same Way
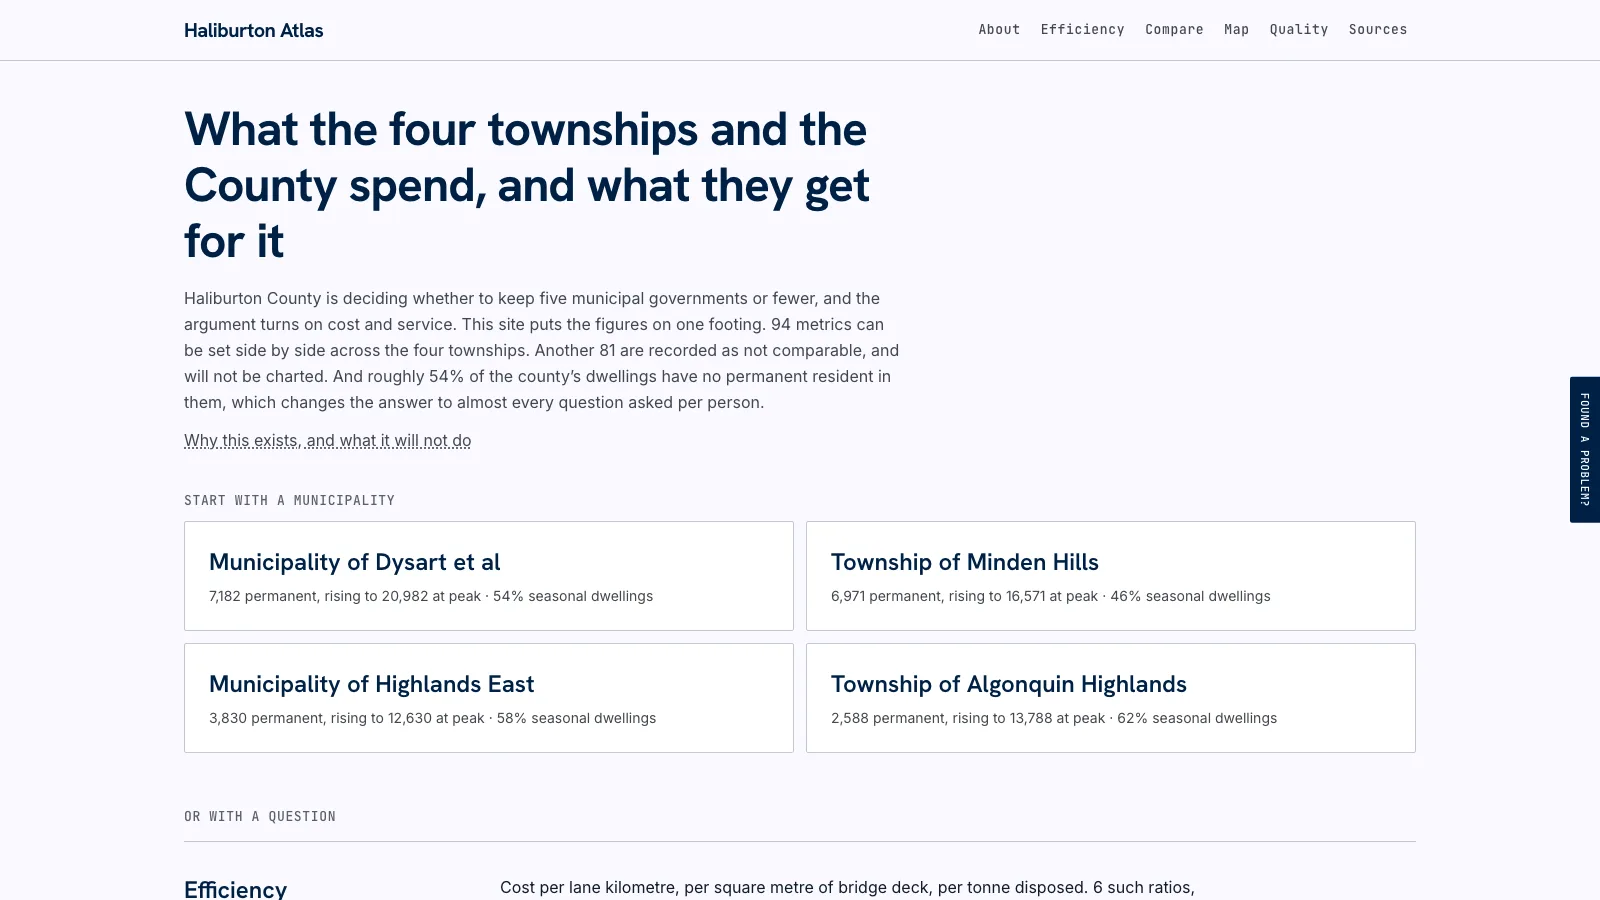
Haliburton County is deciding whether to keep five municipal governments or fewer, and the argument turns entirely on cost and service. Haliburton Atlas puts 94 metrics on one footing across the four townships, records 81 more as not comparable and refuses to chart them, and handles the county's enormous seasonal population by dividing by the person-year instead of by permanent residents. It takes no position on amalgamation. It just makes the figures checkable.
In August, the Eastern Ontario Regional Network put four restructuring models to Haliburton County councillors, along with financials indicating that taxpayers can no longer afford the present two-tier structure of County and townships. Keep things as they are. Amalgamate into a single tier. Strengthen the County and keep four townships. Strengthen the County and consolidate the four townships into two.
The councils elected this autumn are the ones that choose. Fifty-seven candidates are running for twenty-three seats.
Every version of this argument comes down to the same handful of questions. Do four road departments cost more than one? Does a smaller township pay more per resident for the same service? Did amalgamation elsewhere deliver what it promised? Those are questions about figures, and the figures were sitting in four Financial Information Returns, four sets of council minutes and a provincial database, on lines that do not always mean the same thing in each municipality.
So I built somewhere to check them.
What Turned Out to Be Hard
I expected the hard part to be finding the data. It wasn't. Ontario makes every municipality file a Financial Information Return, the census publishes profiles for each census subdivision, and the townships post their agenda packages online. The raw material is public.
The hard part was that four separately incorporated municipalities define almost nothing the same way, and nothing in the filings tells you where they diverge. You find out by trying to divide one number by another and getting an answer that is obviously wrong.
Ninety-four metrics survived that process and can be set side by side. Eighty-one did not, and they are recorded as not comparable with the reason attached rather than quietly dropped. Saying which is which is most of the value here. A reader who sees a chart is entitled to assume somebody checked that the two bars mean the same thing.
Here is the kind of thing that gets a metric excluded. Spending per paved lane kilometre looks like a fair comparison until you notice Highlands East files sixteen lane kilometres of hot mix as its paved network while its neighbours count surface treatment in theirs. Divide the spending by that denominator and Highlands East appears to spend $136,392 per lane kilometre on pavement. That is not a cost. It is a filing convention wearing a dollar sign. Unpaved roads are the other half of the same split, so both are off the chart.
The Financial Information Return has more of these than you would like. Figures are as filed and are not audited by the ministry. Consolidation boundaries differ, so a municipality that consolidates a library board or a community centre shows those costs in its expense lines while a municipality that does not shows a transfer instead. Amortization is included in total expenses after adjustments under public sector accounting standards, which means these are not cash outlays. Minden Hills has not filed for 2024 yet, so most of the comparisons draw on 2023, and the waste figures on 2021, because that is the most recent year all four filed the numerator and the denominator.
None of that is fixable at my end. A municipality filing a department on a different line from its neighbour is not a bug in my pipeline, and smoothing it over would mean choosing a number on their behalf.
The Denominator Problem
Then there is the part specific to cottage country, and it is worse than I expected.
A budget line says almost nothing alone. Dysart et al spends more than Algonquin Highlands on nearly everything, and it also has three times the permanent population. Dividing by people is supposed to fix that.
Except this county has no agreed number of people.
On the 2021 census, Algonquin Highlands holds 2,588 residents in February and up to 13,788 in August. That is a multiple of 5.3, and all of those people use the roads, put out garbage, and call the fire department. Across the county, roughly 54% of dwellings have no permanent resident in them. Dysart et al goes from 7,182 to 20,982. Minden Hills goes from 6,971 to 16,571. Highlands East goes from 3,830 to 12,630, with 58% of its dwellings seasonal.
Pick a divisor and watch the order change. That is not a figure of speech. Divided by the person-year, Algonquin Highlands carries the highest figure on 20 of 64 rows. Divided by permanent residents, it carries the highest on 34, because you have handed a township that serves close to fourteen thousand people in July a denominator of twenty-five hundred.
Every benchmarking report a councillor has ever been shown divides by permanent residents. In a county where more than half the dwellings are not lived in year round, that quietly answers a different question than the one being asked.
So the atlas offers three bases and makes you see the choice. Per permanent resident, per peak resident, and per person-year, which is the default: permanent residents plus seasonal dwellings weighted for the share of the year they are actually occupied. Algonquin Highlands works out to 5,948 person-years in 2021, still the smallest of the four, so almost everything it does remains large per head. The switch sits above the table, and the caption tells you what changed when you flip it.
The result is worth sitting with. Total operating expenses per person-year in 2023 run $1,498 in Highlands East, $1,518 in Minden Hills, $1,567 in Dysart et al and $1,638 in Algonquin Highlands. Four municipalities of very different sizes, within nine percent of each other, once you count the people being served rather than the people on the voters list.
Efficiency Without a Population
The denominator problem is why the efficiency page works the way it does.
Efficiency, here, is what a unit of service costs to deliver. Not what a municipality spends per head. A road kilometre means the same thing in four municipalities, where a dollar per resident does not, and a ratio with a kilometre underneath it never has to pick a population at all. The seasonal argument simply does not arise.
Six such ratios exist in the data. Four can be scored honestly:
- Winter control spending per lane kilometre, from $954 in Highlands East to $2,820 in Algonquin Highlands
- Bridge and culvert spending per square metre of deck, from $31 in Minden Hills to $314 in Dysart et al
- Disposal spending per tonne disposed, from $295 in Minden Hills to $1,192 in Highlands East
- Diversion spending per tonne diverted, from $146 in Highlands East to $423 in Algonquin Highlands
Two are held back, and they are the paved and unpaved lane kilometre figures described above.
Four measures is not many. One of them moving moves the average a quarter of the way, and the page says so. It also says the thing that limits the whole exercise: cheaper per unit is more efficient only if the unit is the same, and nothing in these filings establishes that the kilometre was ploughed to the same standard. This is half of efficiency, and it is the half that can be measured.
The other half, cost per person served, is reported but not scored. Ordering four municipalities from least to most spent is not an order of merit. Spending less may be thrift, or it may be a road deferred onto the next council. I do not know which, so the atlas does not pretend to.
Publishing the Problems Instead of Fixing Them
Thirty-five families of checks run over the figures on every build. What they find is published on a quality page rather than quietly resolved: 301 warnings, 294 notes, zero errors, across 5,570 values.
Zero errors means no figure here contradicts another figure here, and the build stops if that stops being true. It does not mean the figures are right. A municipality can file something wrong consistently, and several have.
The warnings are mostly year over year moves large enough to be a definitional change rather than a real one, flagged so nobody charts them without checking first. Some of them turn out to be real. County long term liabilities rose from $1.5 million in 2019 to $7.7 million by 2022 and have come down since, which is genuine borrowing rather than a filing error, and that review is published next to the warning that triggered it.
The rule underneath all of this is that a gap is a recorded absence with a reason, never a zero and never an estimate borrowed from a neighbour. Nothing looks exactly like a municipality that does not publish. There are 789 such gaps, plus 824 values recorded as not applicable because the body does not do that work. Every figure also carries how it was obtained: 2,838 observed, 1,072 derived, 37 modelled, 10 estimated.
How It Is Built
Twenty-eight sources are registered and fourteen currently supply figures, each recorded with its publisher, its licence, and what it structurally cannot answer. That last field is the one I would keep if I could keep only one. It is what stops a reader asking a channel a question it was never able to answer, like treating police calls for service as a crime rate, or reading provincial centreline length as a maintained road inventory.
Python for the pipeline, Next.js for the site, prerendered and served from a VPS with no database behind it. Exactly one thing loads from another host, and it is my own Matomo instance.
The code and much of the writing were done with Claude Code. No figure on the site comes from a model. Every one traces to a document somebody filed, and the checks that would catch an invented number run on every build. Everything rebuilds from source with one command, and the build refuses to publish while any figure contradicts another.
What It Will Not Do
It does not take a position on amalgamation. Nothing is ranked overall, and no municipality is called better run than another. Most metrics record their direction as contested, because spending less is thrift or neglect depending on what you think a municipality is for.
It does not confuse a place with a council. How pleasant a township is to live in and how well it is administered are different questions, and the figures that answer the first are kept apart from the figures that answer the second.
And it is not the study. Read the report first, and the atlas after, as a way of checking the figures underneath it.
The four models will be argued about all autumn, and most of that argument will be conducted in numbers. The least I can do is make the numbers checkable, and be honest about the ones that were never comparable in the first place.
Frequently Asked Questions
What is Haliburton Atlas?
Haliburton Atlas is an independent civic-data project that compares what the four Haliburton County townships and the County itself spend, and what they get for it. It puts 94 metrics on a footing where the municipalities can be set beside each other, records 81 more as not comparable and declines to chart them, and attaches a source, a basis and a caveat to every figure. It lives at www.haliburtonatlas.ca.
Why does the atlas exist now?
The Eastern Ontario Regional Network, engaged by the County to run an affordability and governance structure study, put four restructuring models to County and local councillors on 12 August 2026, with financials indicating the present two-tier structure is not affordable as it stands. The councils elected this autumn are the ones that choose. Every case for and against turns on cost and service, and until now those figures sat in four Financial Information Returns, four sets of council minutes and a provincial database.
Does the atlas take a position on amalgamation?
No. Nothing is ranked overall and no municipality is called better run than another. Most metrics record their direction as contested, because spending less is thrift or neglect depending on what you think a municipality is for. The atlas is also not the study: it holds none of the consultants' workings and does not restate their conclusions.
Why is seasonal population such a problem?
Roughly 54% of the county's dwellings have no permanent resident, and the four townships swing hard between February and August. Algonquin Highlands holds 2,588 permanent residents and up to 13,788 at peak, a multiple of 5.3, and all of them use the roads. Dividing municipal spending by permanent residents quietly answers a different question than dividing it by the people actually being served, so the atlas offers three bases and defaults to the person-year: permanent residents plus seasonal dwellings weighted for the share of the year they are occupied.
How does the atlas measure efficiency?
By what a unit of service costs to deliver rather than by what a municipality spends per head. A road kilometre means the same thing in four municipalities where a dollar per resident does not, and a ratio with a kilometre underneath it never has to pick a population at all. Six such ratios were built, four are scored, and two are held back because paved and unpaved lane kilometres are counted differently in each township.
Where do the figures come from?
Twenty-eight registered sources, fourteen of them currently supplying figures, each recorded with its publisher, its licence and what it structurally cannot answer. Financial figures come from the Financial Information Return every Ontario municipality files. Counts and caseloads come from the municipalities' own agenda packages and reports. Population and dwellings come from the 2021 census. Where a municipality's own document contradicts a provincial one, the municipality wins.

Colin Smillie
Most recently VP Technology at YMCA Canada. Building and shipping real products with AI-assisted development. More about Colin's advisory and executive work at colinsmillie.com.