
Welcome to Toraffic.ca: Asking Better Questions About Toronto Traffic
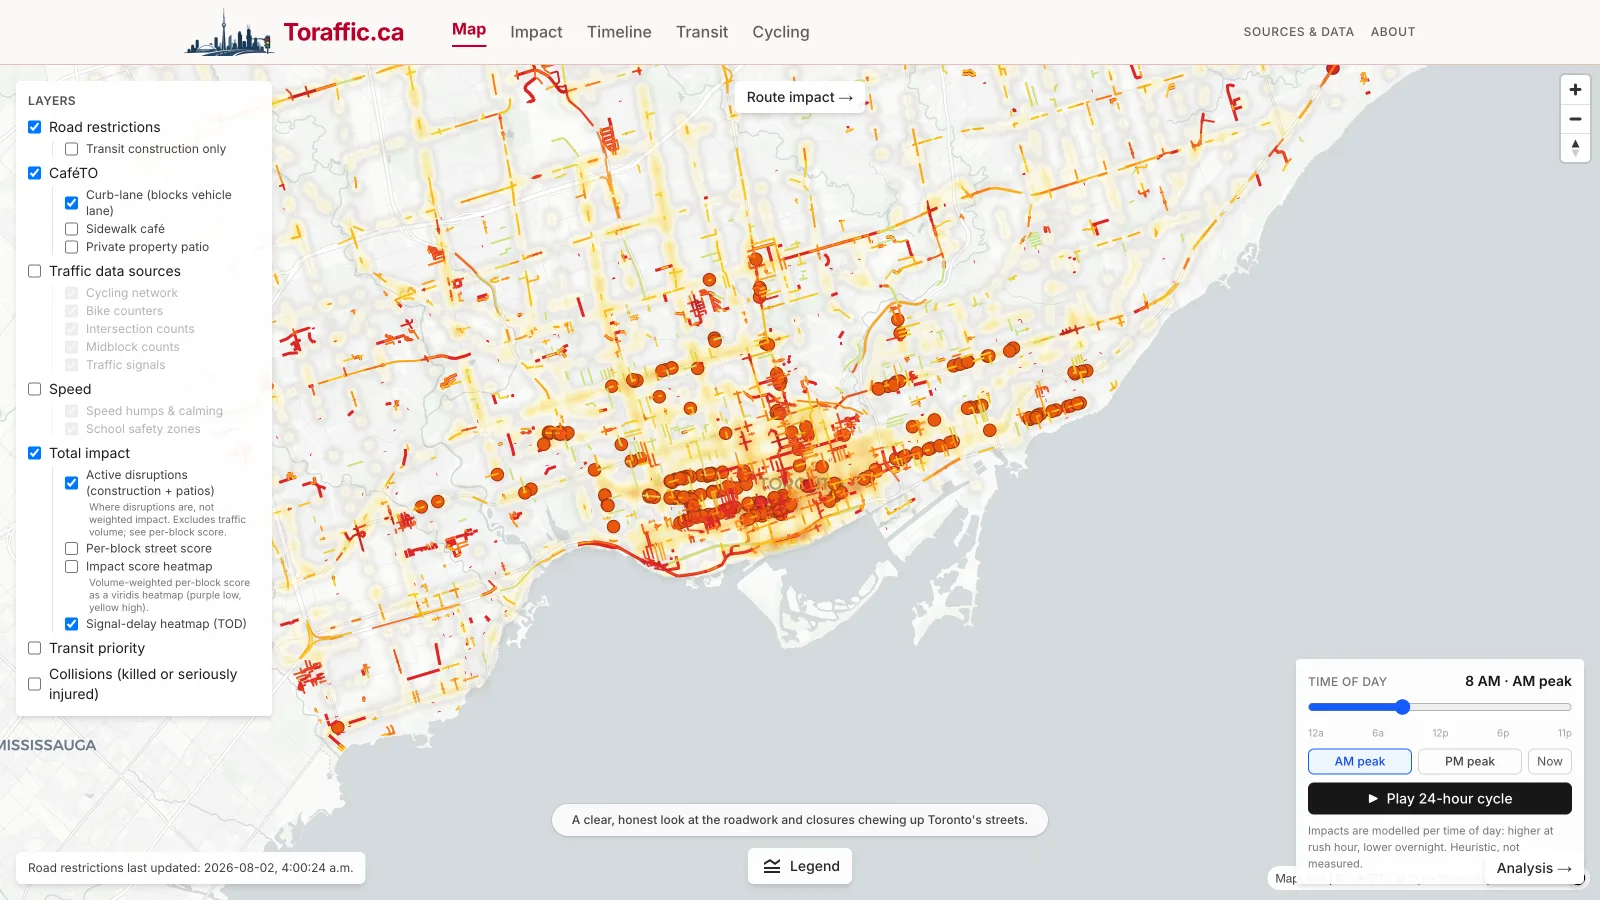
Toronto keeps having the same transportation argument, and it rarely starts from the data. Toraffic.ca is my attempt to fix that. It pulls seven City of Toronto open datasets into one map and adds an OSRM-based impact score that estimates how much each closure, patio, or construction site slows nearby trips. It is not a pro-car, pro-bike, or pro-transit site. It is a pro-evidence one, and the score is labelled honestly as an approximation rather than dressed up as precision it does not have.
Toronto seems to be having the same argument over and over again.
Should we build more bike lanes or remove them? Should patios take over curb lanes every summer? Should we prioritize buses and streetcars over private vehicles? Should roads move people, move goods, or create places where people want to spend time?
This year alone we've seen the return of CaféTO, continued debate over Premier Doug Ford's efforts to remove major Toronto bike lanes, and new transit-priority corridors on streets like Dundas. Each announcement generates thousands of comments, headlines, and opinions. What it doesn't generate is much discussion grounded in the actual data.
That's why I built Toraffic.ca.
This isn't a pro-car website, a pro-bike website, or even a pro-transit website.
It's a pro-evidence website.
Transportation is one of the few public policy areas that almost everyone experiences every single day. Whether you're driving to work, cycling to school, walking to a restaurant, taking the TTC, or delivering goods across the city, traffic decisions affect your time, your safety, and your quality of life. Yet many of our debates seem to start with conclusions rather than questions.
I want to reverse that.
The Questions Worth Asking
Rather than arguing whether a particular project is "good" or "bad," I'd like to explore questions such as:
Do bike lanes reduce or increase congestion under different conditions? What happens to nearby streets when vehicle lanes are removed? Does CaféTO create more economic value than the parking or travel lanes it replaces? How should we measure the success of a transit-priority corridor? Are we optimizing for moving vehicles, moving people, supporting local businesses, or improving safety? What trade-offs are we making, and are they achieving the intended outcomes? How should we balance the needs of commuters, residents, businesses, emergency services, pedestrians, cyclists, and transit riders?
These aren't simple questions, and they rarely have simple answers.
Looking Beyond Politics
Transportation has increasingly become political theatre.
Premier Doug Ford has made removing bike lanes a signature issue, arguing they contribute to gridlock, while the City of Toronto has continued expanding cycling infrastructure and transit priority measures. The courts have gotten involved too, which tells you how significant these decisions have become for both provincial and municipal governments.
At the same time, Toronto keeps investing in projects meant to improve mobility, from rapid transit expansion to dedicated transit corridors and seasonal street activations. Each project promises benefits. Each project also comes with costs and trade-offs.
The challenge is separating evidence from ideology.
How Toraffic.ca Actually Works
Here's the part that matters more than my opinions: where the numbers come from.
The City of Toronto publishes a genuinely large amount of open data on how the city moves. Road restrictions, cycling counts, intersection counts, signal metadata. The problem isn't that the data doesn't exist. It's that it's scattered across feeds and formats, updated on different schedules, and effectively invisible to anyone who isn't already comfortable pulling from an open data portal.
Toraffic.ca pulls seven City of Toronto datasets into one place, synced on each feed's own cadence into a spatial database:
- Road restrictions (construction, events, closures)
- CaféTO curb-lane and parklet café locations
- The cycling network
- Permanent bicycle counters, sites and daily counts
- Intersection turning-movement counts, going back to 1984
- Midblock vehicle counts, going back to 1989
- Traffic signals, including accessibility features, transit signal priority, and pedestrian head-start intervals
Right now the site is tracking 2,138 active restrictions across 44,166 centreline intersections and 2,549 traffic signals. All of it sourced from open data, all of it linked back to the original City of Toronto dataset and license.
To go from raw restriction data to something you can actually reason about, I built a self-hosted routing engine on OSRM that plans trips two ways: once with current disruptions factored in, once without. The difference between those two routes is the impact score, attributed back to whichever source caused it, whether that's a construction closure, a CaféTO patio, or something else entirely.
I want to be direct about what that score is and isn't. It's an estimate. Not a measured travel time, not a promise, not a prediction. Data alone is just noise. Context is what makes it information, and the impact score is my attempt at that context, labelled honestly as an approximation rather than dressed up as precision it doesn't have.
One more thing worth saying plainly: this is not an official City of Toronto service, and the road-restriction feed reflects approved bookings, not real-time incidents. If a closure hasn't been reported to the city yet, Toraffic.ca won't know about it either.
What You'll Find Here
On Toraffic.ca, I'll be examining transportation projects using publicly available data, government reports, traffic counts, open data, academic research, and, where appropriate, my own analysis.
Sometimes the evidence may support a project. Sometimes it may suggest adjustments. Sometimes it may show that both sides of an argument are partially right.
The goal isn't to win debates.
The goal is to understand how Toronto actually works.
Because before we decide how to move our city, we should first understand how it's moving today.
Welcome to the conversation.
Frequently Asked Questions
What is Toraffic.ca?
Toraffic.ca is an independent civic-data project that maps how Toronto moves. It pulls seven City of Toronto open datasets into one interactive map, covering road restrictions, CaféTO patios, the cycling network, bicycle counters, intersection counts, midblock vehicle counts, and traffic signals, and adds an impact score that estimates how much each disruption slows nearby trips. The site lives at www.toraffic.ca.
Is Toraffic.ca pro-car, pro-bike, or pro-transit?
None of those. It is a pro-evidence site. The goal is not to win the bike-lane or CaféTO debate but to ground it in publicly available data, government reports, traffic counts, and open data, and to be honest about the tradeoffs each project makes rather than starting from a conclusion.
Where does the data come from?
Seven City of Toronto open datasets, synced on each feed's own cadence into a spatial database: road restrictions (construction, events, closures), CaféTO curb-lane and parklet café locations, the cycling network, permanent bicycle counters, intersection turning-movement counts going back to 1984, midblock vehicle counts going back to 1989, and traffic signals including accessibility features, transit signal priority, and pedestrian head-start intervals. Everything links back to the original City of Toronto dataset and licence.
How is the impact score calculated?
A self-hosted routing engine on OSRM plans each trip two ways, once with current disruptions factored in and once without. The difference between those two routes is the impact score, attributed back to whichever source caused it, whether that is a construction closure, a CaféTO patio, or something else. It is an estimate, not a measured travel time and not a prediction, and it is labelled that way on purpose.
How much is Toraffic.ca currently tracking?
At the time of launch, 2,138 active restrictions across 44,166 centreline intersections and 2,549 traffic signals, all sourced from City of Toronto open data.
Is this an official City of Toronto service?
No. Toraffic.ca is an independent project from Idea Warehouse. It uses City of Toronto open data but is not endorsed by or affiliated with the City of Toronto. The road-restriction feed reflects approved bookings, not real-time incidents, so if a closure has not been reported to the city yet, Toraffic.ca will not know about it either.

Colin Smillie
Most recently VP Technology at YMCA Canada. Building and shipping real products with AI-assisted development. More about Colin's advisory and executive work at colinsmillie.com.