Building the Toronto Parks Atlas: Reading 3,273 Toronto Parks Through Jane Jacobs
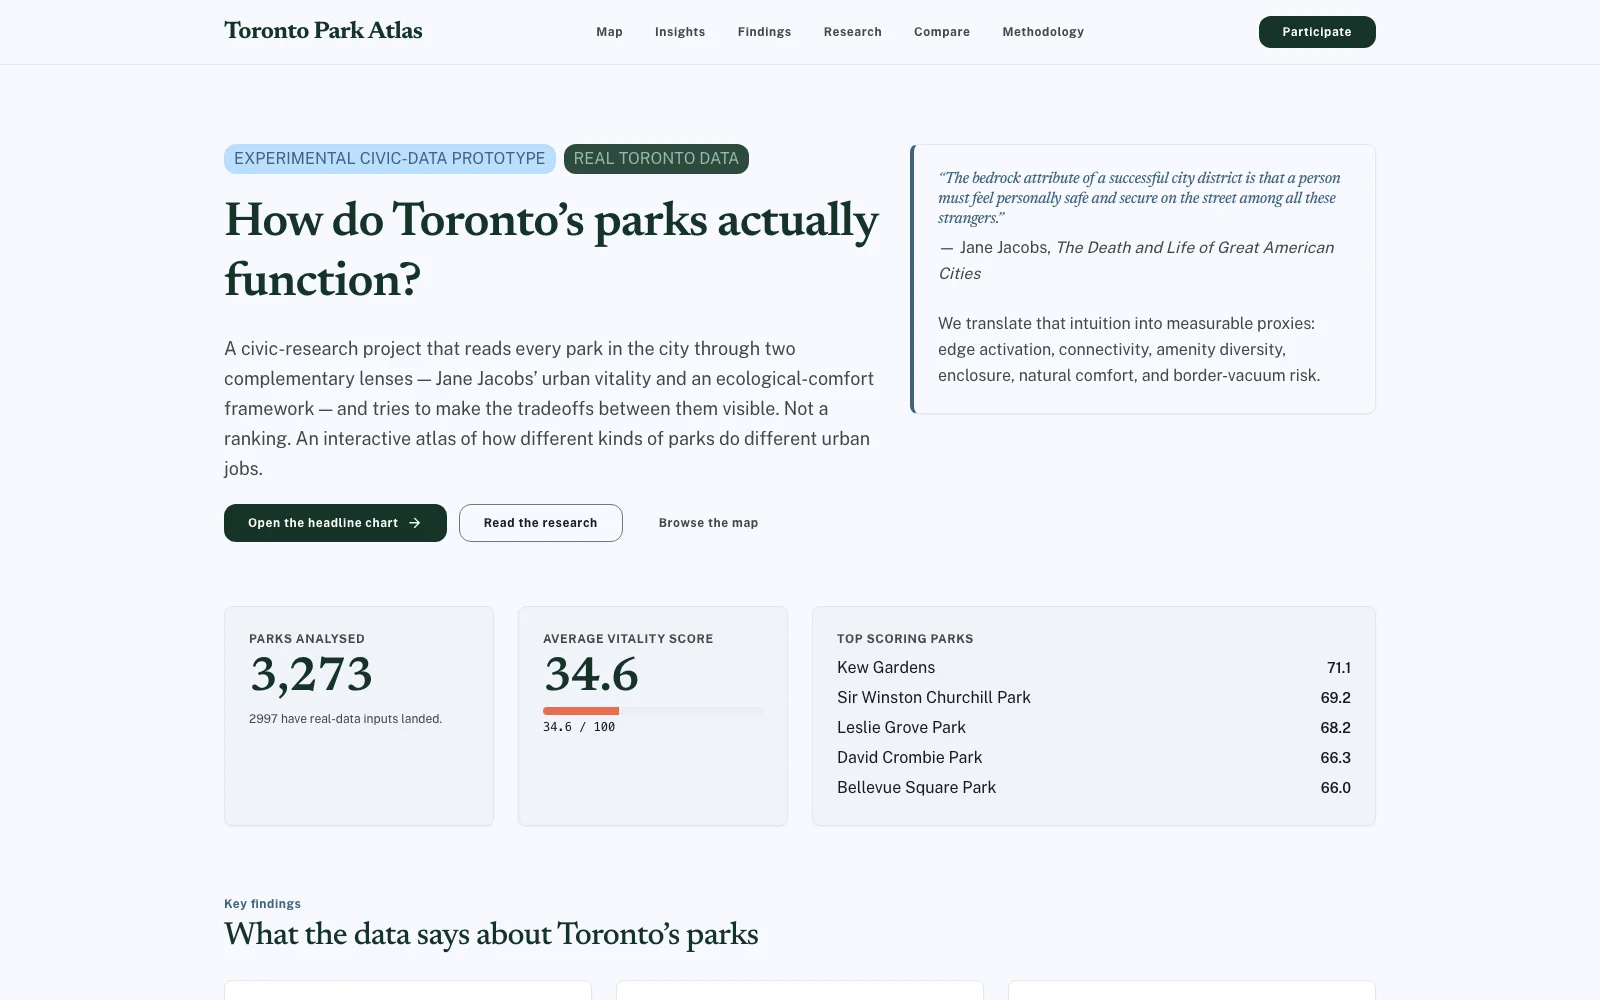
Most park guides rank by which one is nicest. The Toronto Parks Atlas asks a different question: is this park doing the urban work parks are supposed to do? Scoring all 3,273 of Toronto's parks across two axes, Jacobs urban-vitality and ecological-comfort, reveals a bimodal city. Only 7% of parks score well on both, and the patterns that fall out of the data are not the ones single rankings would surface.
It started with a re-read.
In early 2026, after fifteen years of carrying The Death and Life of Great American Cities around mostly as a reference, I sat back down and actually read it again. The first time through, the book had stuck with me as a set of slogans. "Eyes on the street." "Mixed primary uses." "Short blocks." The second reading was different. The argument is sharper than the slogans suggest, and the chapter on parks is more skeptical and more demanding than I remembered.
Jacobs does not think parks are inherently good. She thinks neighbourhood parks are created by the urban form around them. The same patch of green can be a treasured living room or a feared dead zone depending entirely on what presses up against it.
That sat badly with the way Toronto talks about its parks. We rank them. We celebrate the iconic ones. We lament that there aren't more of them. And we mostly ignore the question Jacobs was actually asking: is this park doing the urban work parks are supposed to do?
So I tried to make that question askable at the scale of the whole city.
Two Lenses, Not One Ranking
The insight that drove everything: there isn't a single thing parks are for.
A Jacobs-style reading values how a park functions inside the city. Edges that hum, surrounding buildings with windows facing in, connections to the streets around them. The ingredients that make a park feel alive and used.
A wilderness-style reading values almost the opposite. Distance from the edges. Canopy. Water. The ingredients that make a park feel like a refuge from the city instead of part of it.
Both readings are legitimate. They are also, often, in direct tension. Trinity Bellwoods scores well on Jacobs and poorly on wilderness. Rouge National Urban Park is the other way around. Most of Toronto's parks live closer to one axis than to the balanced hybrid people often imagine.
That two-axis framing is the headline chart on the site, and it's the most important thing on it. A single number flattens the tradeoff. Two axes preserve it. Once I saw the city through that frame, I couldn't unsee it.
What 3,273 Parks Actually Say
Once the scoring was running across the whole city, six patterns came out of the data that I did not expect to find.
Toronto's park system is bimodal. Of 3,273 parks, only 220 score above 50 on both urban integration and natural comfort. That is 7%. The catalogue divides cleanly into urban social parks that are good for daily life and exposed to heat, and ecological retreats that are cooled and shaded but hard to get to. Genuine balanced hybrids, the parks that do both jobs at once, are rare. The split is structural, not accidental.
Parkettes punch above their weight. The 505 pocket parks under one hectare average almost exactly the citywide score. That should be surprising. They are tiny. But tightly framed by mid-rise rowhouses, well-served by transit, with multiple access points along their tiny perimeters, parkettes capture the conditions Jacobs argued for almost by accident. The biggest gainers in the model are all small downtown parkettes that nobody talks about.
Ravines are excellent ecology and terrible city. 1,115 parks, fully a third of the catalogue, sit in the high-natural / low-urban quadrant. Toronto's ravines score above 90 on natural comfort while their connectivity stays below 15. The same conditions that make the ravine valuable as an ecosystem are the conditions that make it inaccessible for everyday urban use. The ravine is a national treasure. It is also not a neighbourhood park.
The waterfront reaches everyone and frames nothing. Toronto's lakefront strip is exceptionally well-served by transit and pedestrian infrastructure, and the waterfront parks score correspondingly well on connectivity. They score poorly on enclosure. There is almost no built edge between Lake Shore Boulevard and the water, so the parks have little frame and almost no eyes on them. The result is parks that reach a lot of people without offering much social grain.
The best-framed parks are pre-war. The parks with the highest enclosure scores in the city are nearly all surrounded by buildings of three to seven storeys, the form most of pre-war Toronto was built in. Eight of the top enclosure scores belong to obscure little parkettes nobody nominates as great parks: Belmont, Bernard Avenue, Montclair, Glasgow, Boswell. The mid-rise neighbourhoods around them are doing the work. New construction at this scale has largely stopped; tower-and-podium has replaced it. The data picks up the difference clearly.
Tower-in-the-park landscapes consistently underperform. There is a pattern the model auto-detects called tower-shadow: parks where the enclosure score is technically high but driven by tower walls rather than mid-rise frontage. These parks pay the comfort and shadow costs without getting the ground-floor activity. The urban form does not deliver the conditions Jacobs described, and that has stayed remarkably consistent across the catalogue.
None of these are policy recommendations. But they do suggest that planning conversations about new parks should pay attention to the form of building that surrounds them, not just the size of the green parcel.
What I Learned Building It
A handful of things surprised me along the way.
Toronto's open data is rich and excellent in coverage. It is also wildly inconsistent on names, fields, and conventions across files. The dataset rewards patience and punishes assumptions.
I spent weeks trying to find the One True Score. Every weighting scheme produced a different "best" park, and none felt right. The framing that finally clicked was that the question itself was wrong. Naming the tradeoff is more honest than collapsing it.
The validation surface mattered more than the model. Locals know their parks better than any open-data pipeline ever will. So the site is built around ways for people to push back: thumbs up and thumbs down, perception ratings, structured long-form feedback, volunteer observation uploads. The point isn't to defend the rankings. The point is to make the model's reading visible alongside everyone else's, and let the disagreement live where you can see it.
Privacy turned out to be an architecture decision, not a policy decision. No accounts, no per-row publishing of feedback, contact info kept off public data structures by construction. The policy was easy to write because the code already enforced it.
Where This Goes Next
The MVP is live. 3,273 parks, six dimensions, the two-axis framework, narrative explanations, ways for people to push back.
From here I want real pedestrian counts so the model can see who actually shows up, not just whether the form supports it. An equity layer from the Neighbourhood Profiles. Seasonal and time-of-day modelling. And probably a version of this for other Canadian cities, since the open-data shape is similar enough that the pipeline ports cleanly.
Final Thought
The provocative thing about this project has nothing to do with parks.
We are watching a shift in what civic research can look like. Open data, a clear methodology, and public validation infrastructure is a different kind of artifact than the reports planning departments used to publish. It surfaces tradeoffs instead of single rankings. It makes the model wrong in public so it can get less wrong over time.
If you are building something in this space, or thinking about how civic research should be structured to last past its author, I would love to compare notes.
Frequently Asked Questions
What is the Toronto Parks Atlas?
The Toronto Parks Atlas is an open-data civic-research project that reads all 3,273 of Toronto's mapped parks through two complementary lenses: Jane Jacobs' urban-vitality framework and an ecological-comfort framework. Every park is scored across six dimensions, classified into one of twelve typologies, and described with an auto-generated narrative covering its strengths, weaknesses, and tradeoffs. The site lives at www.torontoparksatlas.ca.
How is it different from a parks directory or ranking guide?
Most park guides rank by which park is nicest. The Toronto Parks Atlas asks whether each park is doing the urban work parks are supposed to do, and it answers with two separate scores rather than one combined ranking. A park can be excellent at civic vitality and weak on ecological refuge, or the reverse. Naming the tradeoff is more honest than collapsing it into a single best-to-worst list.
What is the Jacobs vs Wilderness framing?
Jane Jacobs argued that neighbourhood parks are created by the urban form around them. A Jacobs-style reading therefore values edge activation, connectivity, and eyes from surrounding buildings. A wilderness-style reading values the opposite: distance from edges, canopy cover, water, ecological refuge from the city. Both are legitimate ways of valuing a park, and both are often in tension. The headline chart on the site, at https://www.torontoparksatlas.ca/insights/jacobs-vs-wilderness, plots every Toronto park on those two axes simultaneously.
What does the data say about Toronto's park system overall?
Toronto's park catalogue is bimodal. Of 3,273 parks, only about 7% (220 parks) score above 50 on both urban integration and natural comfort. The system divides cleanly into urban social parks that are good for daily life but heat-exposed, and ecological retreats that are cooled and shaded but hard to get to. Genuine balanced hybrids are rare, and the split is structural rather than accidental.
Where does the data come from?
City of Toronto Open Data (Green Spaces, Parks and Recreation Facilities, Centreline V2, Pedestrian Network, Treed Area, Ravine Bylaw Areas, Waterbodies, Street Tree Inventory, 3D Massing, Neighbourhoods) plus OpenStreetMap. The full ETL is pure Python with no GDAL or GEOS dependencies, runs end-to-end on a laptop in about fifteen minutes, and is reproducible from a single command.
How is the overall score calculated?
Six weighted sub-scores: Edge Activation (25%), Connectivity (20%), Amenity Diversity (20%), Natural Comfort (15%), Enclosure / Eyes on Park (10%), and Border Vacuum Risk inverted (10%). Each sub-score has its own explanation, confidence value, and percentile rank. Weights are configurable via environment variables so anyone can re-run the scoring with their own priorities. The methodology page spells out every calculation in plain English.
Can people contribute their own observations?
Yes. The site has three contribution paths: structured feedback on any park or on the methodology itself, five-dimension perception ratings, and CSV uploads of 30-minute volunteer observations. The /participate page walks through each option. All submissions are aggregate-only, no individual identification, and contact info is visible only to project admins.
Is visitor data tracked?
Self-hosted analytics via Matomo at analytics.ideawarehouse.ca, with IP anonymisation on and no cross-site profiling. No third-party advertising trackers, behavioural ad pixels, or social-network beacons. Feedback and ratings are stored aggregate-only with no IP attached. The full disclosure is on /privacy.
Is this affiliated with the City of Toronto?
No. The Toronto Parks Atlas is an independent civic-research project from Idea Warehouse. It uses City of Toronto Open Data under the Open Government Licence (Toronto) and OpenStreetMap data under the ODbL, but it is not endorsed by or affiliated with the City of Toronto in any official capacity.

Colin Smillie
Most recently VP Technology at YMCA Canada. Building and shipping real products with AI-assisted development. More about Colin's advisory and executive work at colinsmillie.com.